recombinant mouse timp2 (Bio-Techne corporation)
90
Structured Review
Bio-Techne corporation
recombinant mouse timp2
Recombinant Mouse Timp2, supplied by Bio-Techne corporation, used in various techniques. Bioz Stars score: 90/100, based on 7 PubMed citations. ZERO BIAS - scores, article reviews, protocol conditions and more
https://www.bioz.com/result/recombinant mouse timp2/product/Bio-Techne corporation
Average 90 stars, based on 7 article reviews
recombinant mouse timp2 - by Bioz Stars,
2026-03
90/100 stars
Images
1) Product Images from "Neuronal TIMP2 regulates hippocampus-dependent plasticity and extracellular matrix complexity"
Article Title: Neuronal TIMP2 regulates hippocampus-dependent plasticity and extracellular matrix complexity
Journal: bioRxiv
doi: 10.1101/2022.12.28.522138
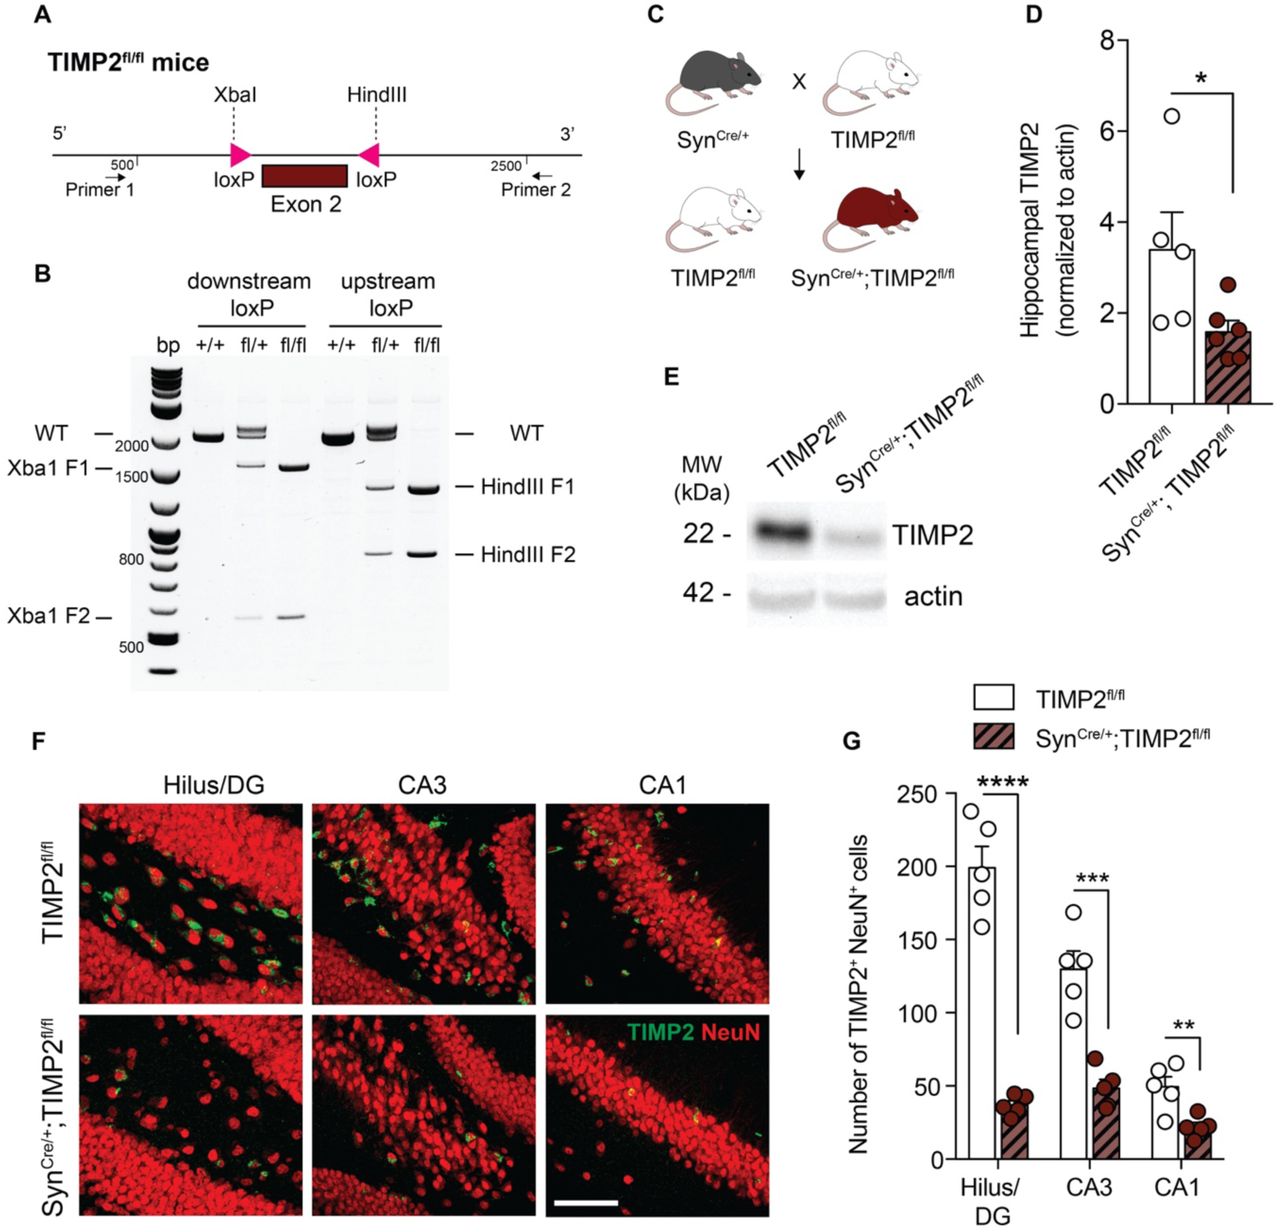
Figure Legend Snippet: (A) Schematic illustration of the targeting strategy of to insert loxP sites flanking exon 2 to generate a model for conditional deletion of TIMP2 . (B) Representative genotyping results revealing the PCR products for the mutant LoxP and wild-type alleles. Wild-type (+/+), heterozygous (fl/+), and homozygous (fl/fl) mice were identified according to this strategy. (C) Schematic diagram of cross-breeding strategy to establish neuron-specific TIMP2 deletion: male TIMP2 fl/fl mice were mated with Syn Cre/+ females to obtain Syn Cre/+ ; TIMP2 fl/fl and their respective TIMP2 fl/fl littermate controls. (D-E) Representative TIMP2 immunoblot and corresponding quantification of TIMP2 protein levels from hippocampal lysate of TIMP2 fl/fl and Syn Cre/+ ; TIMP2 fl/fl (2-3 months of age, N = 5-6 mice per group). (F) High-magnification view of hilus/DG, CA3, and CA1 sub-regions of TIMP2+ cells co-expressing NeuN in TIMP2 fl/fl and Syn Cre/+ ; TIMP2 fl/fl mice (2-3 months of age, N = 5 mice per group, scale bar, 20 μm) with corresponding (G) quantification of the total number of TIMP2+ cells with NeuN+ nuclei across hippocampal subregions. Data are represented as mean ± SEM. Student’s t-test for two-group comparisons. * P <0.05, ** P <0.01, *** P <0.001, **** P <0.0001. Data points represent individual mice.
Techniques Used: Mutagenesis, Western Blot, Expressing
 of hilus/DG, CA3, and CA1 subregions showing TIMP2 + and TIMP2 + NeuN + cells. Scale ...")
Figure Legend Snippet: (A) Low-magnification view (upper image) of mouse hippocampus and high-magnification view (lower images) of hilus/DG, CA3, and CA1 subregions showing TIMP2 + and TIMP2 + NeuN + cells. Scale bars, 200 μm and 20 μm (inset). (B) Quantification of the total number of TIMP2 + cells and TIMP2 + NeuN + cells across hippocampal subregions in WT mice (2 months of age; N = 8, males and females). (C) Schematic representation of high molecular-weight cut-off (1-MDa) in vivo microdialysis to assay TIMP2 levels in mouse hippocampal ISF. (D) TIMP2 immunoblotting of hippocampal ISF dialyzed from 2-month-old WT and TIMP2 KO mice, with corresponding Ponceau S stain. (E) Schematic representation of bulk RNA-seq workflow performed in isolated WT and TIMP2 KO hippocampi (N=13-17/group, sex-matched) for transcriptomic analysis. (F) Volcano plot showing the fold-change of genes (log 2 scale) differentially expressed in hippocampus of TIMP2 KO vs. WT mice. Downregulated DEGs at P < 0.05 are highlighted in red (upregulated in black). (G) Top 10 significant pathways for downregulated DEGs from Gene Set Enrichment Analysis. Data are represented as mean ± SEM. DG, dentate gyrus; eISF, exchangeable interstitial fluid; aCSF, artificial cerebrospinal fluid.
Techniques Used: Molecular Weight, In Vivo, Western Blot, Staining, RNA Sequencing Assay, Isolation
 Quantification of the total number of TIMP2 + and TIMP2 + NeuN + cells at ...")
Figure Legend Snippet: (A) Quantification of the total number of TIMP2 + and TIMP2 + NeuN + cells at the hilus/DG, (B) CA3 and (C) CA1 subregions of the hippocampus from WT males and females at 2 months of age (N = 4 mice per sex). (D) Cresyl violet-stained section depicting the microdialysis probe tract through brain surface extending into hippocampus, with microdialysis probe position seen at Bregma - 3.08mm based on Paxinos and Watson atlas. Scale bar, 500 μm. (E) Top 10 significant pathways for upregulated DEGs in hippocampi of TIMP2 KO mice relative to WT mice (N = 13-17 mice per group). Data are represented as mean ± SEM.
Techniques Used: Staining

Figure Legend Snippet: (A) Schematic timeline of BrdU intraperitoneal injection protocol to label proliferating cells in the DG in isolated brain sections. (B) Schematic timeline of BrdU intraperitoneal injection protocol used for cell fate “survival” labeling in DG of isolated brain sections. (C) Representative confocal microscopy images of BrdU + cells in the DG of WT and TIMP2 KO mice (2-3 months of age, N = 11-12 mice per group; arrowheads indicate BrdU + cells; scale bar, 50 μm) with corresponding (D) quantification of number of BrdU + cells in the dentate gyrus per unit area. (E) Representative confocal microscopy images of proliferating Ki67 + cells in the DG of WT and TIMP2 KO mice (2-3 months of age, N = 11-12 mice per group; arrowheads indicate Ki67 + cells; scale bar, 50 μm) with corresponding (F) quantification of the number of Ki67 + proliferating cells per DG in WT and TIMP2 KO mice. (G) Representative confocal microscopy images of Sox2 + in the DG of WT and TIMP2 KO mice (2-3 months of age, N = 11-12 mice per group; arrowheads indicate Sox2 + cells; scale bar, 50 μm) with corresponding (H) quantification of Sox2 + neural progenitor cells in the DG of WT and TIMP2 KO mice. (I) Representative confocal microscopy images of DCX + cells in the DG of WT and TIMP2 KO mice (2-3 months of age, N = 11-12 mice per group; scale bar, 50 μm) with corresponding (J) quantification of DCX + immature neuroblasts in DG of WT and TIMP2 KO mice. (K) Representative confocal microscopy images of BrdU + NeuN + cells in DG of WT and TIMP2 KO mice (2-3 months of age. N = 8-11 mice per group; scale bar, 50 μm and 100 μm (inset)) with corresponding (L) quantification of newborn neurons (BrdU + NeuN + cells) in the DG of WT and TIMP2 KO mice. Data are represented as mean ± SEM. Student’s t -test for two-group comparisons. * P <0.05; ** P <0.01; *** P <0.001. Data points represent individual mice. IHC, immunohistochemistry; DG, dentate gyrus; DCX, doublecortin.
Techniques Used: Injection, Isolation, Labeling, Confocal Microscopy, Immunohistochemistry

Figure Legend Snippet: (A) Schematic representation of the workflow for dendritic spine quantification using Lucifer Yellow-filled DG granule cells. (B) Overall dendritic spine density in DG granule cells iontophoretically labeled with Lucifer Yellow using sections isolated from six-month-old WT and TIMP2 KO mice (N=6 neurons per mouse from N=4-5 mice per group). (C) Quantification of the percentage of spines categorized according to “thin” spine heads or (D) “mushroom” spine heads. (E) Representative deconvolved confocal image of a dendritic segment from WT and TIMP2 KO Lucifer Yellow-labeled brain sections, and the downstream 3D reconstruction, with dendritic segment shown in pink, thin spines in green, stubby in blue, mushroom in red, and filopodia in yellow. Scale bar, 2 μm. Data are represented as mean ± SEM. Nested t-test for comparisons with neuron and mouse as levels. * P <0.05; ** P <0.01. Data points represent neurons (left) and mice (right) for each group. LY, Lucifer Yellow.
Techniques Used: Labeling, Isolation

Figure Legend Snippet: (A) Schematic of the novel location recognition assay. (B) Discrimination index for novel location recognition on day 2 for WT and TIMP2 KO mice (2-3 months of age, N = 11-12 mice per group). (C) Schematic of the contextual and cued fear-conditioning assay. (D, E) Freezing levels by interval and overall measured in the conditioned-fear context A in WT and TIMP2 KO mice (2-3 months of age, N = 11-12 mice per group). (F) Schematic diagram of modified Barnes maze with color coding for overall strategy classification. (G) Proportion of WT and TIMP2 KO mice using non-hippocampus-dependent (gray) and hippocampus-dependent (yellow) strategies during the testing trials (2-3 months of age, n = 9 mice per group). (H) Strategy utilization by WT and TIMP2 KO mice on day 3 of the Barnes Maze and corresponding (I) cognitive scores, ranked by strategy complexity for WT and TIMP2 KO mice on day 3 in the Barnes Maze. Data are represented as mean ± SEM. Student’s t-test for two-group comparisons in (B, D, E) , chi-square test in (H) , and nested t-test (I) for trial and mouse levels. * P <0.05, ** P <0.01. Data points represent individual mice.
Techniques Used: Modification

Figure Legend Snippet: (A) Percentage of freezing detected in the cued task of the fear-conditioning assay in WT and TIMP2 KO mice (2-3 months of age, N = 12 mice per group). (B) Latency of TIMP2 KO and WT mice to fall in the rotarod in the fixed and (C) acceleration protocol at 4, 20 and 40 rpm (N = 12 mice per group). (D) Total distance traveled by TIMP2 KO and WT mice in the open field, as well as (E) velocity, and (F) percentage of time spent in the center of the arena (N = 11-12 mice per group). (G) Latency of TIMP2 KO and WT mice to fall in the wire test (N = 12 mice per group). (H) Time for TIMP2 KO and WT mice to descend the pole in the pole test (N = 11-12 mice per group). (I) Grip strength of the fore-, hind- and four limbs in TIMP2 KO and WT mice (N = 12 mice per group). (J) Hindlimb extension by clasping score in TIMP2 KO and WT mice (N = 10-11 mice per group). Data are represented as mean ± SEM. Student’s t -test for two-group comparisons. n.s., not significant.
Techniques Used:

Figure Legend Snippet: (A) MMP2 mRNA levels by qPCR from isolated hippocampus of WT and TIMP2 KO mice (2-3 months of age, N = 6 mice per group). (B) Immunoblotting of MMP2 from hippocampal lysates of WT and TIMP2 KO mice (2-3 months of age, N = 9 mice per group) with corresponding (C) quantification of MMP2 protein levels. (D) Representative confocal microscopy images showing aggrecan puncta in the molecular layer of DG from WT and TIMP2 KO mice (2-3 months of age, N = 8-13 mice per group; scale bar, 5 μm) with corresponding (E) quantification of puncta. (F) Representative confocal microscopy images and corresponding (G) quantification of aggrecan and homer1 co-localization in the molecular layer of DG from WT and TIMP2 KO mice (2-3 months of age, N = 8-13 mice per group; scale bar, 5 μm). Circles indicate colocalized puncta. (H) Representative images showing the migration of DCX + cells in the SGZ and GCL of WT and TIMP2 KO mice (2-3 months of age, N = 11-12 mice per group, scale bar, 20 μm with corresponding (I) quantification of DCX + cells distributed in the subgranular zone (SGZ) and granule cell layer (GCL) of DG. (J) Representative surface scanning electron microscopy (SEM) from DG of WT and TIMP2 KO mice (2-3 months of age, N = 3 mice per group, scale bar, 2 μm, with corresponding (K) quantification of ECM microarchitecture in terms of fiber diameter measurements. Data are represented as mean ± SEM. Student’s t-test for two-group comparisons. * P <0.05, ** P <0.01, *** P <0.001. Data points represent individual mice.
Techniques Used: Isolation, Western Blot, Confocal Microscopy, Migration, Electron Microscopy
 contextual fear-conditioning freezing levels in TIMP2 fl/fl and Syn Cre/+ ; TIMP2 fl/fl mice ...")
Figure Legend Snippet: (A) Discrimination index for novel location recognition on day 2 and (B,C) contextual fear-conditioning freezing levels in TIMP2 fl/fl and Syn Cre/+ ; TIMP2 fl/fl mice (2-3 months of age, N = 13-15 mice per group). (D) Proportion of mice of each genotype using non-hippocampus-dependent (gray) and hippocampus-dependent (yellow) search strategies during the testing trials of TIMP2 fl/fl and Syn Cre/+ ; TIMP2 fl/fl mice in Barnes maze (2-3 months of age, N = 12-14 mice per group) with (E) quantification of the percentage of mice using these strategies by on day 3. (F) Cognitive complexity scores for TIMP2 fl/fl and Syn Cre/+ ; TIMP2 fl/fl mice based on strategies used on day 3 of Barnes maze. (G) Representative confocal microscopy images of BrdU + and NeuN + cells in DG of TIMP2 fl/fl and Syn Cre/+ ; TIMP2 fl/fl mice (2-3 months of age, N = 7–8 mice per group, scale bar, 100 μm) with corresponding (H) quantification of BrdU + NeuN + newborn neurons in the DG. (I) Representative confocal microscopy images of aggrecan and homer1 puncta in molecular layer of DG of TIMP2 fl/fl and Syn Cre/+ ; TIMP2 fl/fl mice (N = 7-8 mice per group, scale bar, 5 μm) with corresponding (J) quantification of aggrecan puncta and (K) co-localized puncta of aggrecan and homer1, as indicated by overlaid circles. Data are represented as mean ± SEM. Student’s t -test for two-group comparisons in (A-C) , (H) , and (J, K) , chi-square test in (E) , and nested t-test (F) with trial and mice as levels. * P <0.05, ** P <0.01, *** P <0.001, **** P <0.0001. Data points represent individual mice.
Techniques Used: Confocal Microscopy

Figure Legend Snippet: (A) Percentage of freezing detected in the cued task of the fear-conditioning assay in TIMP2 fl/fl and Syn Cre/+ ; TIMP2 fl/fl mice (2-3 months of age, N = 13-15 mice per group). (B) Latency of TIMP2 fl/fl and Syn Cre/+ ; TIMP2 fl/fl mice to fall in the rotarod in the fixed and (C) acceleration protocol at 4, 10 and 20 rpm (N = 13-15 mice per group). (D) Total distance traveled by TIMP2 fl/fl and Syn Cre/+ ; TIMP2 fl/fl mice in the open field, as well as (E) velocity, and (F) percentage of time spent in the center of the arena (N = 13-15 mice per group). (G) Latency of TIMP2 fl/fl and Syn Cre/+ ; TIMP2 fl/fl mice to fall in the wire test (N = 12-14 mice per group). (H) Time for TIMP2 fl/fl and Syn Cre/+ ; TIMP2 fl/fl mice to descend the pole in the pole test (N = 12-14 mice per group). (I) Grip strength of the fore-, hind- and four limbs in TIMP2 fl/fl and Syn Cre/+ ; TIMP2 fl/fl mice (N = 13-15 mice per group). (J) Hindlimb extension by clasping score in TIMP2 fl/fl and Syn Cre/+ ; TIMP2 fl/fl mice (N = 12-14 mice per group). Data are represented as mean ± SEM. Student’s t -test for two-group comparisons. n.s., not significant.
Techniques Used:


